Trending now: The new Threatened Species Index for Australian birds
Tuesday, 12 March 2019We are familiar with indices like GDP and the ASX indicating trends in the state of the Australian economy. But what about trends in the state of our environment? An exciting new tool called the Threatened Species Index offers a window into how threatened species are faring and if our collective conservation efforts are stacking up for imperilled wildlife. The index has been made possible through unprecedented collaboration and data-sharing by over 40 research partners led by The University of Queensland, working closely with BirdLife Australia. Project co-leader Dr Elisa Bayraktarov outlines the significance of the index and some of the powerful ways it can be used. 
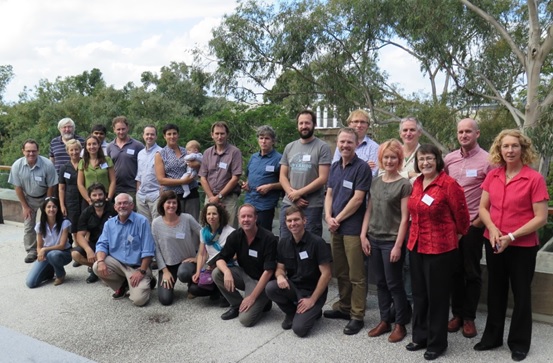
Launch of the Threatened Species Index for Australian birds on 27 November 2018 at the Ecological Society of Australia conference in Brisbane. From left to right: Elisa Bayraktarov (UQ), Glenn Ehmke (BirdLife Australia), Hugh Possingham (The Nature Conservancy), Darren Grover (WWF), Sally Box (Department of the Environment and Energy), Brendan Wintle (University of Melbourne), Ayesha Tulloch (Sydney University), James O’Connor (BirdLife Australia). Photo: Jaana Dielenberg
Australia has over 1800 threatened species. Although monitoring data is available for many of these species individually, until now there has been no way to bring it all together. With many partners, the Threatened Species Recovery Hub has risen to this challenge by creating Australia’s first Threatened Species Index (known as the TSX).
The index is unique in that it compiles all available monitoring data to tell us how our threatened species are doing overall, and also which groups (e.g., shorebirds) or regions need more attention.
Locating and assembling the data is a huge undertaking, and has involved extensive collaboration with all state and territory governments and many other conservation and research organisations. In addition, there are more than 200 Friends of the Index who are supporters, potential end-users, or simply people who care about threatened species and want to know more about the index.
Ultimately the index is capable of compiling data for all threatened species in Australia, from orchids to tree-kangaroos. As a start, we have collected and compiled all available bird data to create Australia’s first threatened bird index. Planning is underway for mammal and plants indices. 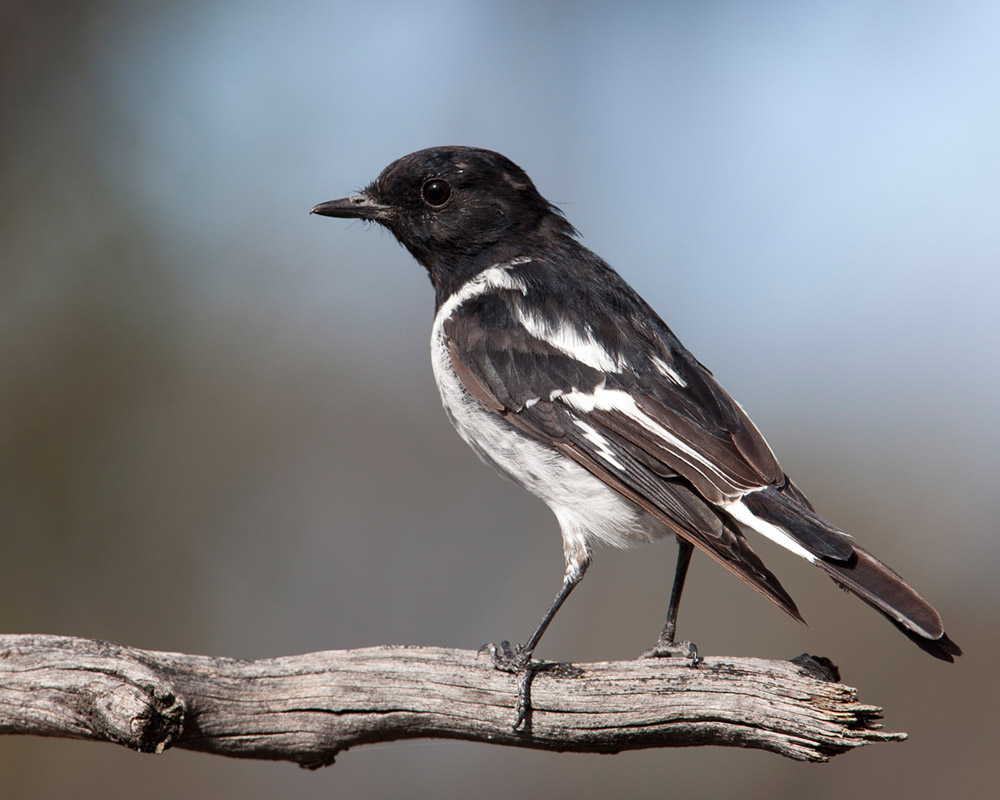
Male south-east hooded robin. Photo: Peter Jacobs from Australia CC BY-SA 2.0 Wikimedia Common
Creating the index
The statistical approach is modelled on the Living Planet Index, which was designed by the World Wildlife Fund and the Zoological Society of London. That index tracks changes in global vertebrate populations over time, and is used to report against international targets. It compiles data from published scientific literature to track the relative population abundance of thousands of mammals, birds, fish, reptiles and amphibians around the world.
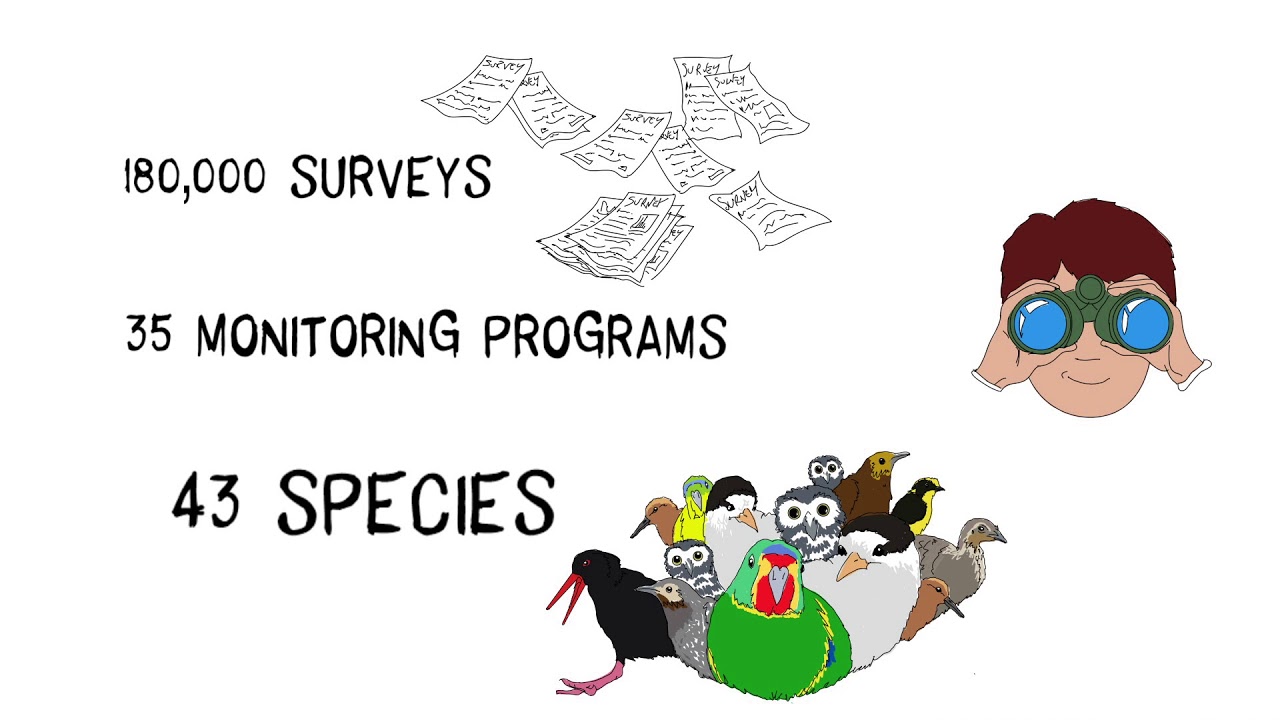
The Living Planet Index has published results every two years since it was initiated in 1998. It was most recently published in October 2018 and showed that on average global vertebrate populations have decreased by 60% between 1970 and 2014. However, for all its value as an international reporting tool, very few Australian threatened species are included in the Living Planet Index – only 24 mammals and seven birds. That is because most data on threatened species in Australia are never published. Rather, they exist as raw data on people’s computers, in the reports of recovery teams and in state or territory government repositories. That is why collaborating directly with the groups who undertake monitoring in Australia was so important to our project. It enabled us to assemble data from over 500,000 individual surveys and 35 monitoring programs just for the birds.
Turning this data, which came in many formats, into a dynamic index was a huge undertaking. The Zoological Society of London helped us to adapt the method of the Living Planet Index. The Terrestrial Ecosystem Research Network, together with the Research Computing Centre of The University of Queensland and a web-app development company called Planticle helped us to develop an automated scientific workflow to streamline data processing. And BirdLife Australia are hosting the raw data and the Threatened Bird Index component of the overall index. 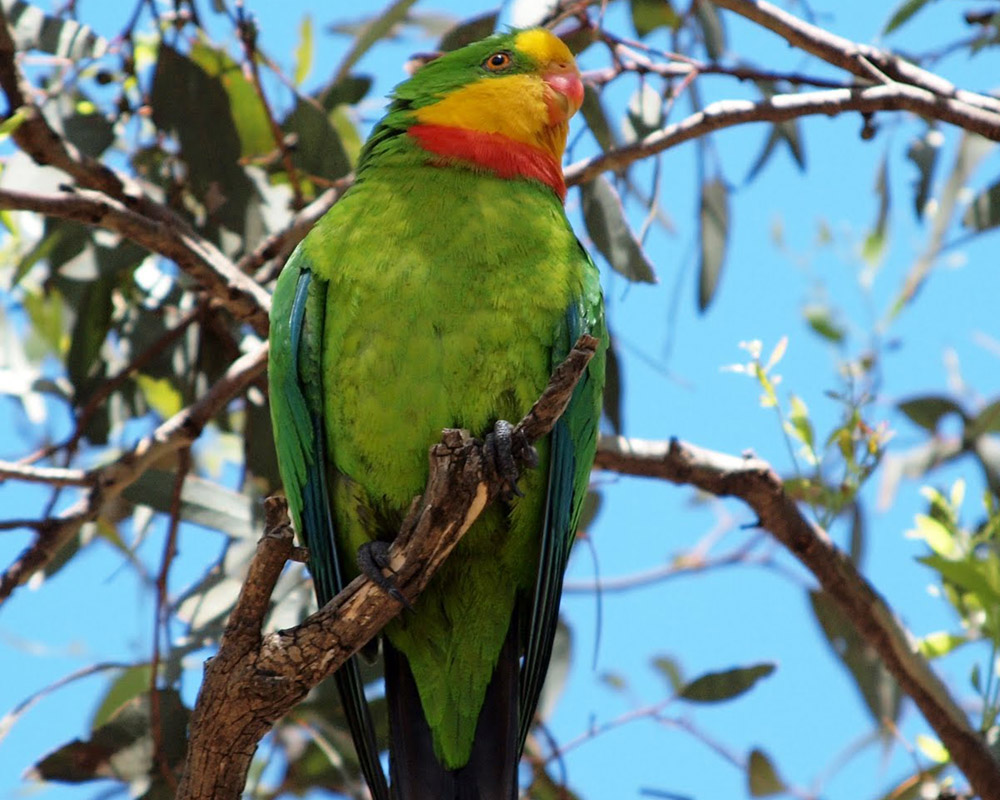
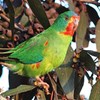
Superb parrot. Photo: Duncan McCaskill CC BY 3.0 Wikimedia
Tracking trends
The index works not by showing population numbers themselves, but by showing the average change in populations compared to a base year. It currently includes data for 43 species and subspecies of bird, which represents about 30% of all nationally listed threatened birds.
The base year for the index has been set at 1985, which gets a score of one. A score of 1.2 would indicate a 20% increase on average in numbers of threatened birds, while a score of 0.8 would indicate a 20% decrease on average since 1985.
The index shows us that between 1985 and 2015 the numbers of the 43 threatened species and subspecies decreased by 52% on average – see Figure 1. There is some variation among individual species within this multi-species index. The grey cloud indicates the variability between the trends for individual birds that build the composite.
One of the most exciting and powerful features of the Threatened Species Index is the ability to look at results for groups of birds, for example, shorebirds, or for regions, like Queensland – or both, for example, Queensland shorebirds.
Figure 2 shows the results when we select shorebirds. The index shows that their numbers have decreased by 72% on average over the past 30 years. The diagnostic tools tell us that this index is based on six species and subspecies, with good coverage for most of Australia’s coastline except for the Northern Territory.
But the Threatened Species Index is not all bad news! For example, if we drill down to produce an index for Victoria’s threatened birds, we obtain an index on 18 species and subspecies whose numbers decrease between 1985 and 2000 but then stabilise (Figure 3). This is where recovery actions may have kicked in and led to some successes.
Over to you
You can explore and use the index at tsx.org.au. It is a dynamic tool to which more data will be added as they become available and are verified. And the more data, species and regions that are added, the more powerful, meaningful and representative the index will become.
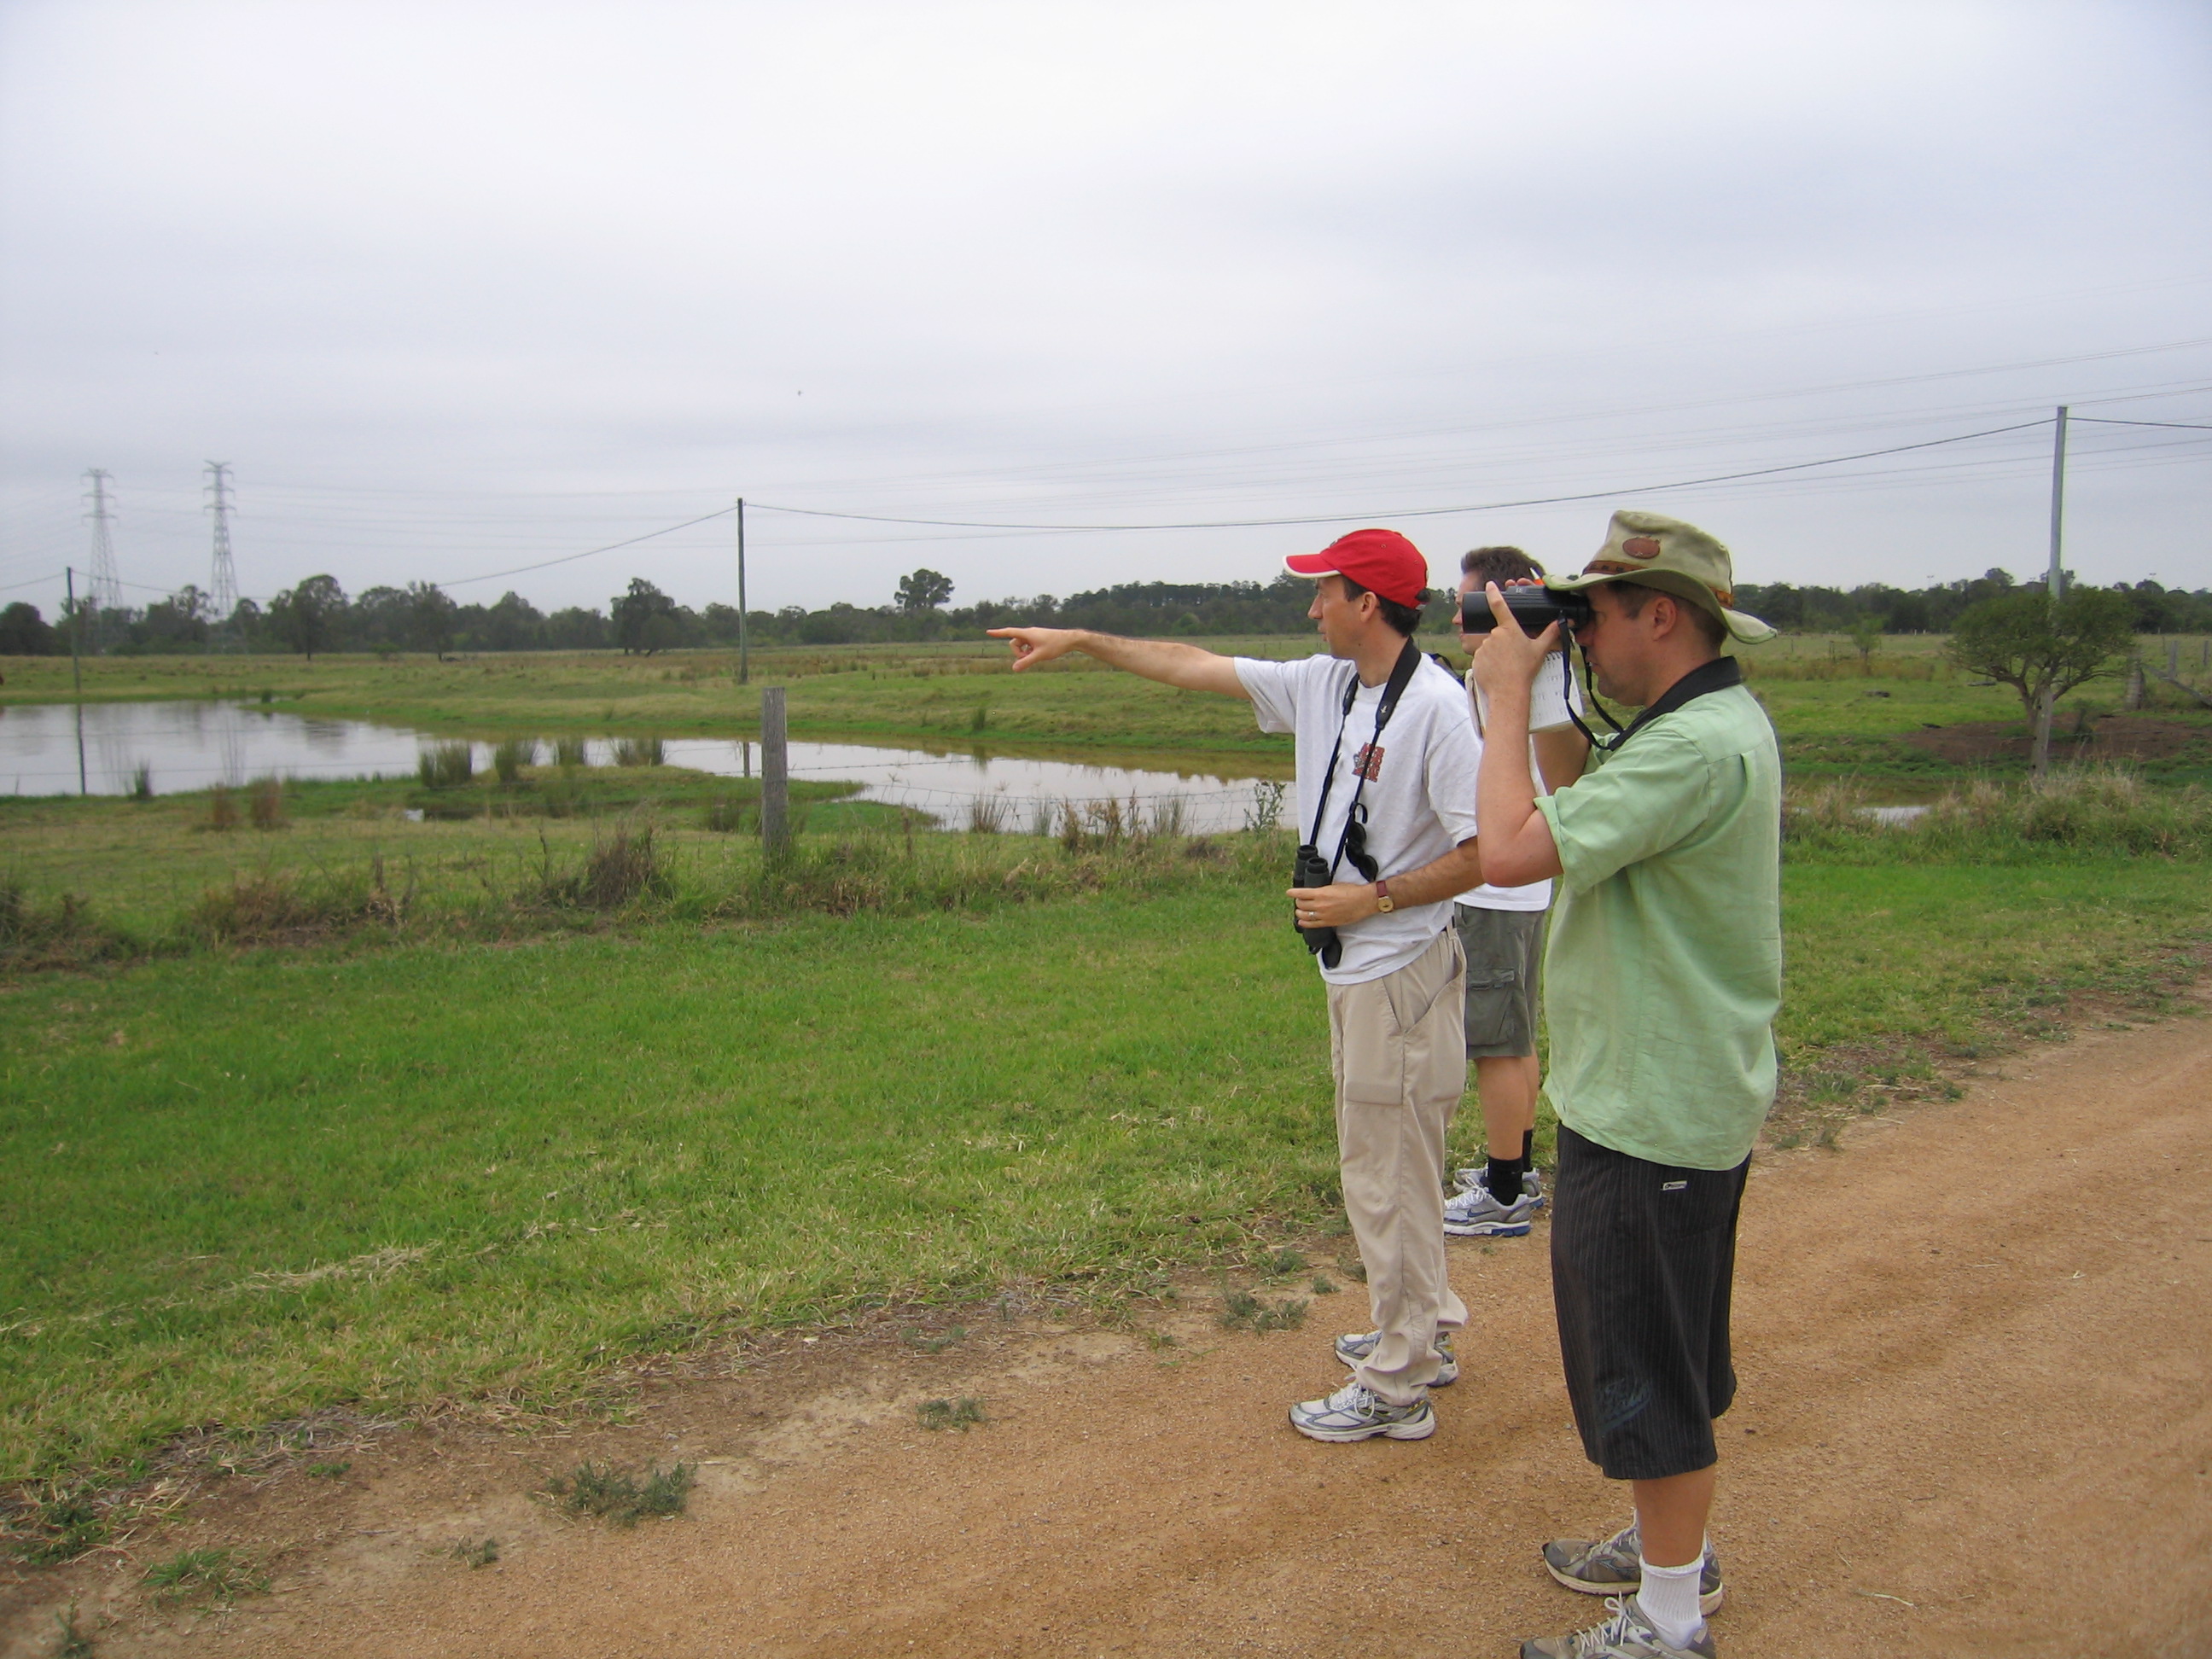
We are always on the lookout for good additional data. If you have data spanning multiple years on threatened or near- threatened Australian bird species and subspecies, we’d be delighted to hear from you.
Australia’s Threatened Species Commissioner Dr Sally Box launched the Threatened Species Index on 27 November 2018 at the Ecological Society of Australia conference in Brisbane. 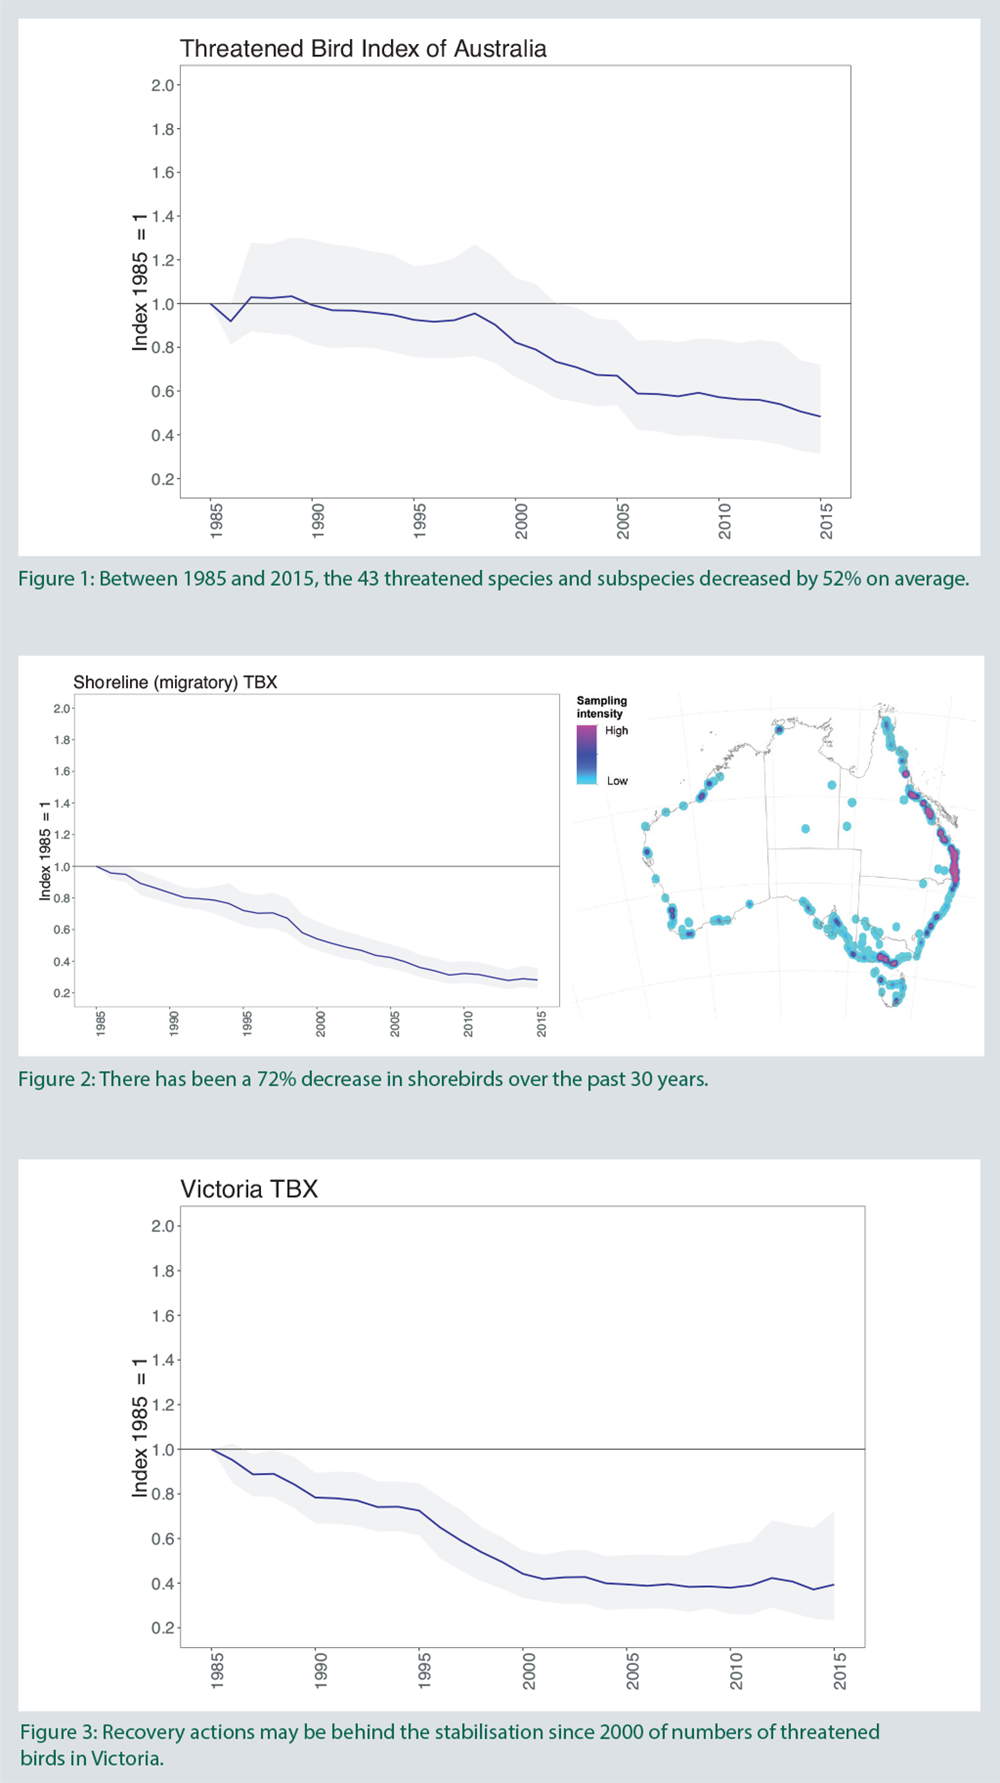
For further information
Elisa Bayraktarov - e.bayraktarov@uq.edu.au
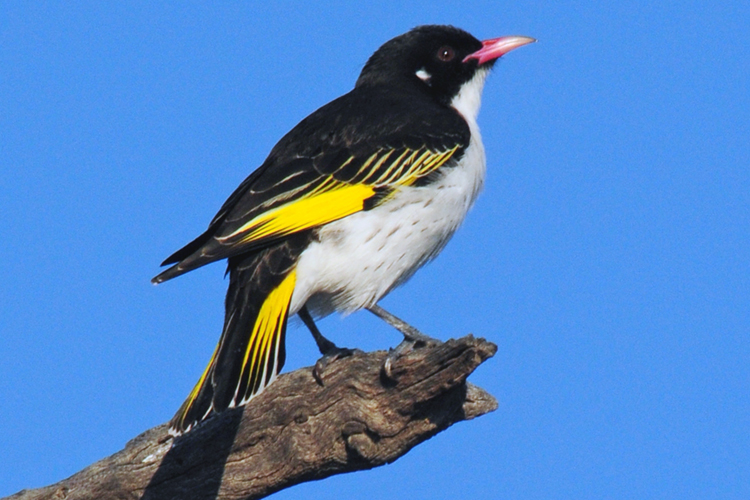
Top image: Painted honeyeater. Photo: Stuart Harris CC BY-SA 2.0 Wikimedia Commons
-
Threatened plant trends in the spotlight
Thursday, 11 March 2021 -
Australian threatened bird populations drop by half in 30 years on average
Tuesday, 27 November 2018 -

Call for threatened species data
Friday, 03 May 2019 -
Calling for big data
Thursday, 06 October 2016 -
Measuring return on investment in threatened species recovery
Monday, 02 May 2016 -
Planning under way for new index
Thursday, 09 June 2016 -
Threatened Plant Index of Australia: 2020 Results
Thursday, 03 December 2020